
Investors had a lot to contend with in 2022 with soaring inflation, rising interest rates, hawkish central banks, weakening economic data, supply chain disruptions, fracturing trade relations, conflict in Europe, and an energy crisis! The transition into a different economic and macro geopolitical environment is well under way and it’s time to get to grips with what might be in store for investors and how we intend to navigate it.
Market commentators have always tried to draw parallels with times past to give investors an idea of what the investment environment may look like going forward. For example, there are similarities (and differences) to the problems we face today and the 1970’s (see our "Lessons from the 70s" article). But financial conditions are never exactly the same, so betting on similar outcomes may not yield the expected results.
Whilst we do not believe history repeats exactly, it almost certainly rhymes, and investors should take note of the forewarning highlighted in this chart.
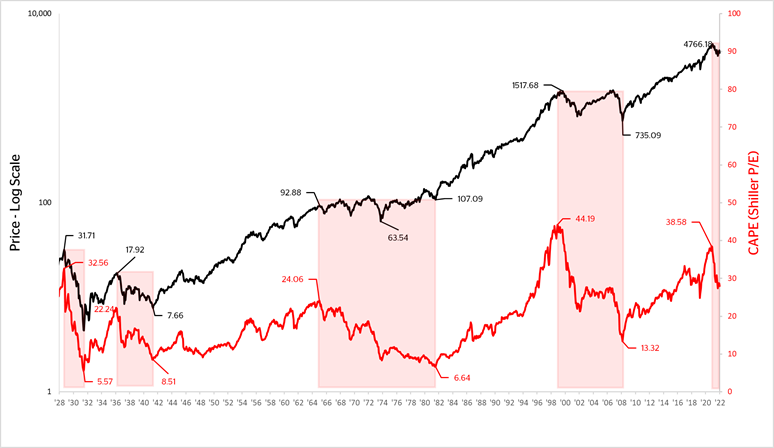
Data: S&P500 in $ Shiller CAPE 1928-2022, monthly intervals. Source: Bloomberg and https://www.multpl.com/shiller-pe , compiled January 2023
To help explain our point we make the following observations:
There are periods where the market (black line) trends upwards. Whilst this period may be punctuated with downturns, the multi-year nature of the uptrend implies they are secular bull markets. There are also periods when the market either falls or goes sideways in a rather volatile manner (highlighted in red). Again, their multi-year nature implies they are secular bear markets. These secular bear markets have always started when valuations - measured using the cyclically-adjusted price-to-earnings ratio[i] (CAPE ) - have reached a secular high. They end when the CAPE has bottomed out, typically in the low double digit / mid-to-high single digit range. 2021’s market high came with a CAPE of over 38.5x (the second highest ever recorded since records of this nature have been calculated).
Is this the secular high for now and are we at the beginning of another multi-year bear market?
The probability is high given the macro-economic backdrop, change in central bank thinking, and the valuation reached in 2021. To help understand how best to navigate what’s coming next we have ‘gone back in time’ to the last secular bear market between 2000-2009.
During this time the market lost 54% from peak to trough and its CAPE (valuation) went from over 44x to under 14x (a fall of >68%). Over those nine years, we witnessed two cyclical bear markets (12/1999 - 07/2002, -50% and 10/2007- 03/2009, -56%) and one cyclical bull market in between.
The secular bull market leading up to the high in 2000 had a similarity with the secular bull market that finished in 2021, in that it was driven by technology stocks. The blue-sky potential of the internet had captured investors’ imagination, setting the foundations for the ‘dot.com boom’. However, despite a good cleansing in the cyclical bear market that followed, technology lagged during the five year bull market that took shape in 2002. This market was driven predominantly by material (mining) and energy companies. Why the underperformance? - a large part of the answer is to do with starting valuations.
To help illustrate the point we will look at how one of the stock market darlings of the dot.com period faired during the whole 2000-2009 period.
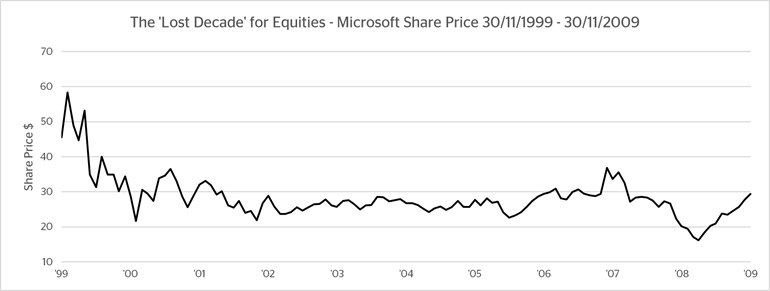
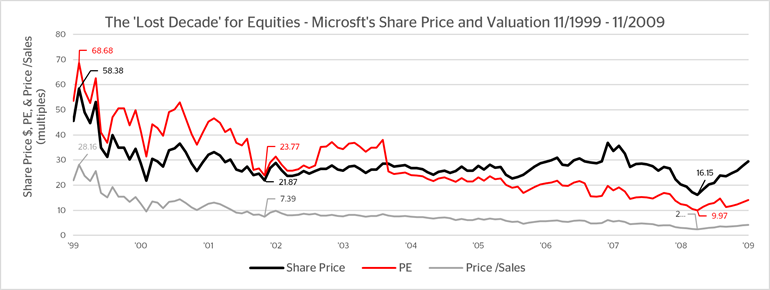
Source: FactSet, compiled January 2023
Ever since its IPO in the 1980s Microsoft has delivered exceptional returns and made its founder Bill Gates one of the wealthiest people on the planet. Even so, there was a period where the stock price tracked sideways for 9 years after it had sunk from its high in 2000, before bottoming out with the market in 2009 post financial crisis – despite continued growth in revenues, profits, cashflows, and earnings per share throughout the period.
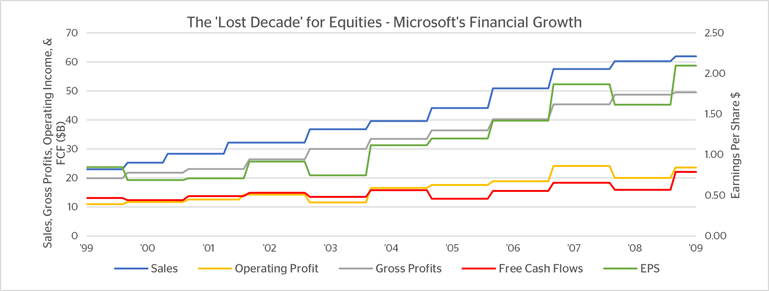
Source: FactSet, compiled January 2023
Valuations and investor sentiment played a big part. The recession that started in 2000 and reallocated capital from growth to defensives saw the most expensive stocks collapse in price; but even when the stock market bottomed in 2003 Microsoft’s price simply meandered underperforming the sector and broader market until its price to earnings (P/E) valuation bottomed out at around 10x.
Source: FactSet, compiled January 2023
Investor sentiment also soured on Microsoft through this period. Steve Ballmer took the reins in early 2000. A divisive character who would ultimately curate a toxic culture. His record would be blemished by a number of high profile poor decisions that often resulted in failed product launches, missing new industry trends, whilst spending billions on acquisitions that would have to be written off. Whilst it wasn’t Microsoft’s ‘finest hour’, Ballmer got enough right - Office, Office 365, Azure, Xbox, and (eventually) the Windows Phone - to almost quadruple revenues, more than triple gross profits and free cash flows.
Investors have a tendency to want to fight the last war and buy into the falling share price of previous successes without much thought for valuations. If the market is likely to grind itself down to a high single/low double digit multiple, it somewhat makes sense to rotate into stocks whose valuations are closer to this end goal. Of course, one shouldn’t simply buy ‘cheap’ stocks for the sake of valuation – one would want the confidence one isn’t buying their way into a value trap. For what we consider desirable, please read part 2 of our 3 part Global Blue Chip Investor Update released in May last year.
To continue with our illustration of what did and did not work during the 2000-2009 secular bear market, we have put together a similar set of charts on the consumer staples business Unilever, which was trading at £8.41 or 13.25x earnings during the height of the dot.com bubble. When the cyclical bear market bottomed in 2002, Unilever was trading at £14.08 (+67%). The 2002-2007 bull market saw ULVR trade as high as £18.90 or 18.6x, so there was something for the Company to give back during the Great Financial Crisis, but its reliable sales and cash flows meant that the ride was less volatile. When all had settled down the monthly low for ULVR was still +57% at £13.18 from its starting price in 2000, with the stock trading on a little over 10x earnings.
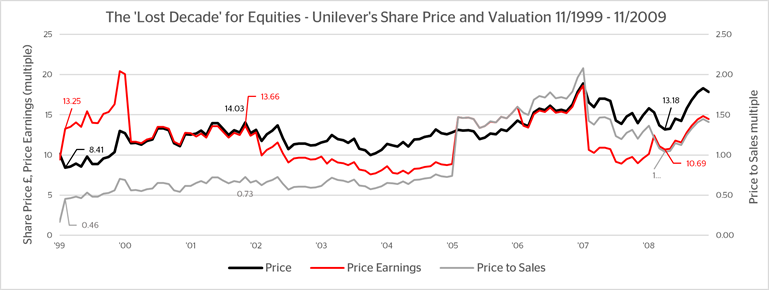
Source: FactSet, compiled January 2023
Unilever’s financial growth profile comes nowhere near that of Microsoft over the same period, yet the share price performance was on a different scale.
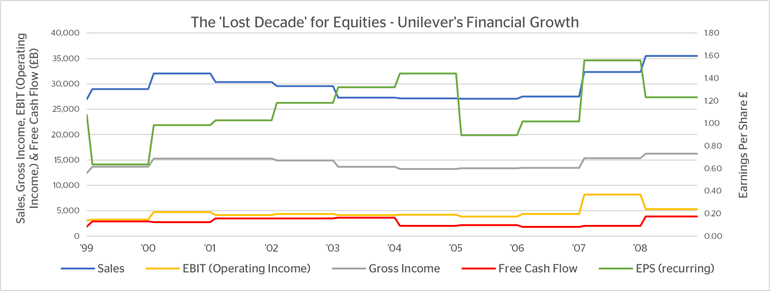
Source: FactSet, compiled January 2023
This lends credence to the theory that no matter how compelling the investment narrative or growth profile of the business you wish to own, the valuation at which you buy your investment will largely determine the outcome. A not too dissimilar lesson taught to us through our study of the 1970s (see above for the link to that article).
Two parallels from times past drawn and two similar lessons noted and we’re acting accordingly.
